

Our driver failed the scientific SFST. What is the probability she was impaired by alcohol? The obvious answer is to use the accuracy of the SFST. If the SFST gives the correct answer 95% of the time, then there's a 95% chance our lady's SFST result was correct. I've told you this doesn't work. There's fancy math to explain but for our purposes it'll work better if I just show you. I'm going to give you an example using real numbers from a real
NHTSA FST validation study, from 1977. The point here is not the
accuracy of this early non-standardized FST. The point is
the concept of scientific accuracy itself. Accuracy is
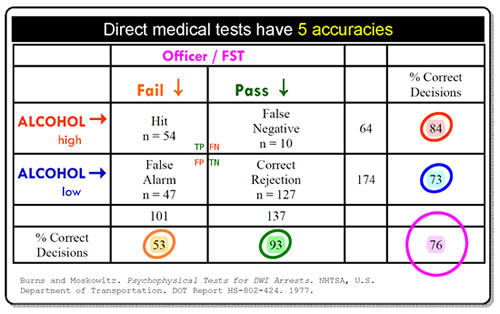
more complicated than you think Here's a Field Sobriety Test accuracy table from NHTSA's original "scientific" FST validation project, Psychophysical Tests for DWI Arrest 1977. I've changed the labels to make the thing easier to read; you can get the original at Pdfs. In this project each person tested had two measurements made: blood alcohol and a Field Sobriety Test. The question is, What percent of the time did the FST measurements correctly predict the alcohol measurements? The answer to that question will be the accuracy of the SFST.
When people were guilty, how accurate was this FST? Look at the row ALCOHOL high→ . Follow the red arrow across to the "% Correct Decisions" column. See the red circle around 84? In this study when people had a high alcohol level, the FST gave the correct answer 84% of the time. When people were guilty, the accuracy of this FST was 84%. When this FST said people were guilty, how accurate was that prediction? Look at the column Fail ↓ . Follow the orange arrow down to the "% Correct Decisions" row. See the orange circle around 53? When people failed this FST, the test was correct only 53% of the time. When this test said people were guilty, the accuracy of the test was 53%—a coin toss. Wait, wait, wait! Those two accuracies are both about people who were guilty. How come they're different— 84%, 53%? The answer is, the two accuracies answer questions that are subtly different. One is about people who are guilty. The other is about people the test says are guilty. Those groups are subtly different. They count different groups of people. So the accuracies are different. And notice that although the difference in what groups to count is subtle, the difference in accuracy—84% vs. a coin toss—is dramatic. When people were innocent,
how accurate was this FST? Blue circle, 73%.
When the Journal of the American Medical Association (impact factor wise, one of the top three medical journals in the world) publishes scientific papers about diagnostic tests, it requires authors to describe diagnostic test accuracy by reporting the statistics sensitivity and specificity. NHTSA's 76% accuracy statistic does not allow us to do this FST, get a result, and know the probability that result was correct. NHTSA's statistic "accuracy" doesn't work. Competent scientists knows all this. Real science does not describe diagnostic tests with the NHTSA's accuracy statistic. Because it doesn't work. Competent science describes diagnostic tests with two special accuracies, sensitivity and specificity, that do allow the calculation of the probability that a test result is correct. You can learn more at: Wikepedia Bayes, web Bayes, web PPV , MEDLINE PPV . |
||
|
Complicateder EXAMPLE: Validating and using an New SFST
The question relevant to DUI guilt is: What is the accuracy of the New SFST when the test has returned the result, "Guilty"? The contractor calculates that accuracy: 95 people were judged to be guilty; blood testing proved each of those people had a high blood alcohol. 95/95 = 100%.The New SFST is 100% accurate. Excellent. Now officers can use the New SFST in the field, confident it has been scientifically validated.
NHTSA says the real SFST gives the correct answer 95% of the time. In this example we'll use that same percentage. Officers administer a New SFST to 100 parishioners 95 pass, and are released. 5 fail, and are arrested. The question relevant to DUI guilt is: What is the accuracy of the New SFST when the test has returned the result, "Guilty"? The contractor is gone, but we know how to calculate the relevant accuracy of DUI convictions based on this new test: 5 people were judged guilty; blood testing would have proved none of them had a high blood alcohol. 0/5 = 0%. Convictions based on the New SFST are 0% accurate. See what happened? Trained DUI officers scientifically validated the New SFST as 100% accurate, but when the same officers did identical New SFST tests in the field, the accuracy of the test was 0%. This is not a trick. This is how real tests work in the real world, which, again, is why real scientists don't describe the performance of diagnostic tests using this statistic. It doesn't work. But this is the SFST statistic US law enforcement uses to convict DUI defendants. |
||
|
Why Scientific Accuracy matters |
 The
table sorts people by test result. Look under the pink label Officer/
FST. People who failed the FST were counted in the Fail
column. People who passed were counted in the Pass
column. Over on the side, people whose measured alcohol was high
went in the ALCOHOL high row. People
whose alcohol was low went it the ALCOHOL
low row. Tables like this set up True Positive, True Negative,
False Positive and False Negative results in a way that makes it
easy to answer important questions about this FST.
The
table sorts people by test result. Look under the pink label Officer/
FST. People who failed the FST were counted in the Fail
column. People who passed were counted in the Pass
column. Over on the side, people whose measured alcohol was high
went in the ALCOHOL high row. People
whose alcohol was low went it the ALCOHOL
low row. Tables like this set up True Positive, True Negative,
False Positive and False Negative results in a way that makes it
easy to answer important questions about this FST. 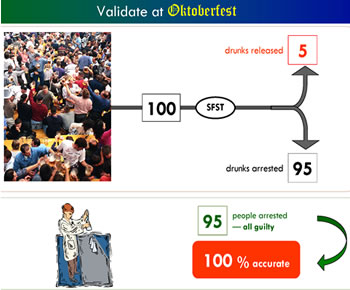 Highly
trained DUI officers make New SFST measurements on Oktoberfesters.
They interpret these measurements according to standardized interpretation
rules. How accurate are those results? Well, NHTSA claims the real
SFST gives the correct answer 95% of the time, so in this example
I'll use that number. Officers test 100 Oktoverfesters. The New
SFST gives the wrong answer 5% of the time, and the correct answer
95% of the time. 95 Ockotberfesters are arrested.
Highly
trained DUI officers make New SFST measurements on Oktoberfesters.
They interpret these measurements according to standardized interpretation
rules. How accurate are those results? Well, NHTSA claims the real
SFST gives the correct answer 95% of the time, so in this example
I'll use that number. Officers test 100 Oktoverfesters. The New
SFST gives the wrong answer 5% of the time, and the correct answer
95% of the time. 95 Ockotberfesters are arrested. 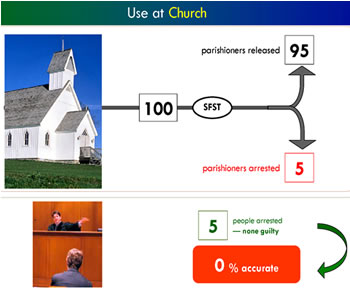 Confident
of the new scientific test, the same DUI officers set up a New SFST
sobriety checkpoint outside a church. The officers administer the
New SFST to parishioners as they drive home from Sunday services.
The officers make exactly the same measurements they made at Oktoberfest;
they interpret those measurements exactly as they did before. No
one leaving church is drunk.
Confident
of the new scientific test, the same DUI officers set up a New SFST
sobriety checkpoint outside a church. The officers administer the
New SFST to parishioners as they drive home from Sunday services.
The officers make exactly the same measurements they made at Oktoberfest;
they interpret those measurements exactly as they did before. No
one leaving church is drunk.
|
