| This web site gives the opinions of Dr. Greg Kane. Everything you read here is expressed only as my personal opinion. |
| © 2008 Nothing here may be reproduced without written permission; Trial Talk articles and raw study data excepted. |

"[I]nformation underlying
an officer’s decision is not documented and cannot be examined" |
| Home | Data | Two Elements | Accuracy | "Using" | Secret Evidence | Threats? |
|
Elsewhere: |
Read NHTSA contract scientist Dr. Stuster's defense against my analysis of NHTSA validation science's "using" flaw. |
Trouble is element two, the assumption, is silly. Every one of the NHTSA's own validation study reports admits it is false:
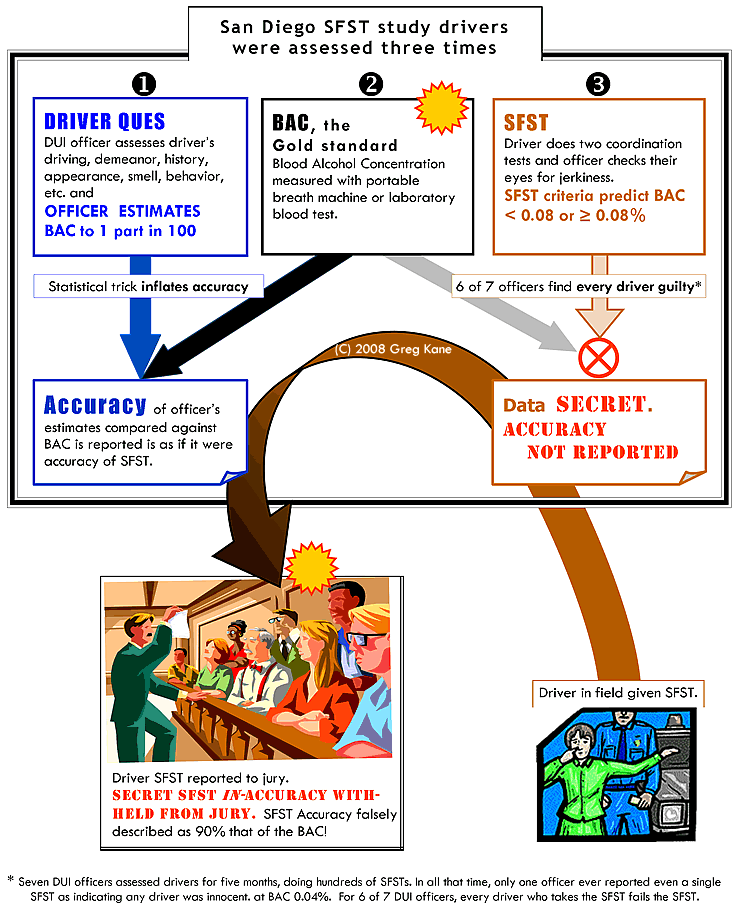
So, every validation study admits officers did not base their decisions entirely on SFSTs, and every validation study fails to measure how much difference that makes to the study's results. In fact, validation studies fail to measure whether officers actually "use SFSTs" at all. Using the previously unpublished San Diego validation study data, I've done the calculation. Officer accuracy and SFST accuracy are different. Officers were 90% accurate. SFSTs were only 78% accurate. (A coin toss is 50% accurate.) The accuracy statistic
is flim flam. Let's look at the real scientific accuracies. Using
the standard scientific accuracy called specificity, on innocent
people officers were 71% accurate. Here are the contingency tables for officer and SFST results. |
|||||||||||||||||||

 Colorado
Validation Study
Colorado
Validation Study San
Diego Validation Study
San
Diego Validation Study  Florida
Validation Study
Florida
Validation Study| Officer
Accuracy 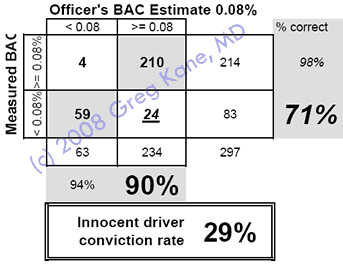 |
SFST
Accuracy 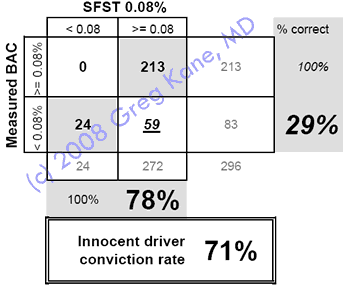 |
These results were released. |
These results were not released. |
Officer decisions were 90% "accurate." The validation study released this irrelevant and misleading datum. But the accuracy of the officer decisions on innocent people (aka "specificity") was only 71%. If juries rely on officer decisions, they will wrongly convict 29% of the innocent people who go to trial. The SFST did much worse. it's innocent driver accuracy was only 29%, leading to a false conviction rate of 71%. The SFST study did not release these SFST results.
I don't know why NHTSA SFST validation studies did not include this damaging information. Dr Stuster's threatening (as I read it) email to me says:
I replied to Dr. Stuster asking why his SFST validation study report
does not reveal the accuracy of the SFST itself. So far Dr.
Stuster hasn't responded.
|
 Officer's estimates more precise than SFST criteria allow.
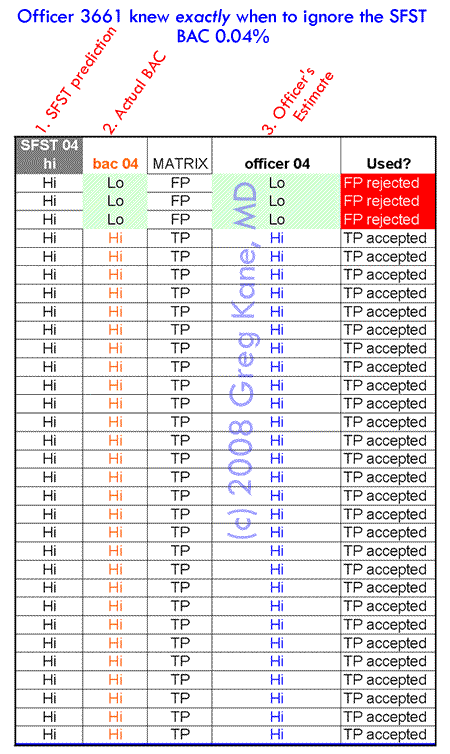 |
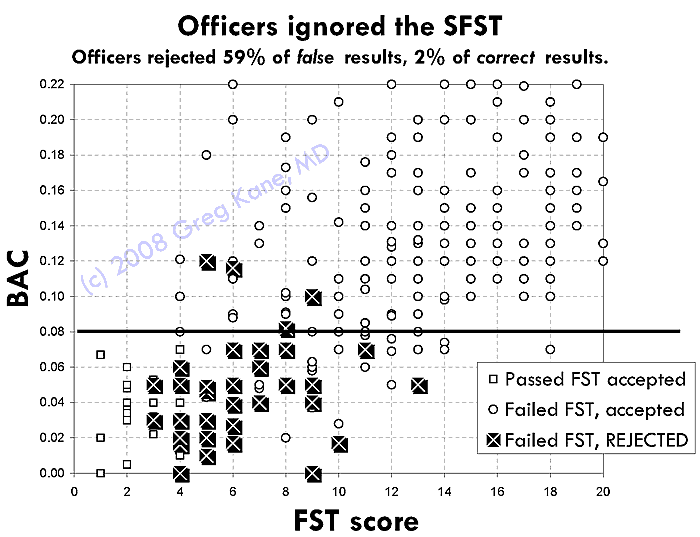
Seven officers assessed drivers for the San Diego SFST study. This table shows results for one officer, identified in the study as Officer 3661. These are the results for every driver this officer assessed. Column 1 gives the SFST's BAC prediction, based on standardized SFST interpretation criteria, for drivers assessed by this one officer. The SFST said every driver tested was impaired, regardless of actual BAC. Column 2 gives the actual driver BAC, simplified to Hi and Lo at BAC 0.04% Column 3 gives the officers BAC estimate, simplified to Hi and Lo at BAC 0.04% NOTICE Every single time the SFST gave the wrong answer, officer 3661 rejected that answer, and correctly estimated the BAC as low. Officer 3661 never once rejected the SFST when the SFST gave the correct answer. The probability that this distribution of rejections was random is vanishingly small. Officer 3661 must have used some method other than the SFST for determining BAC level in every case, for every driver. |
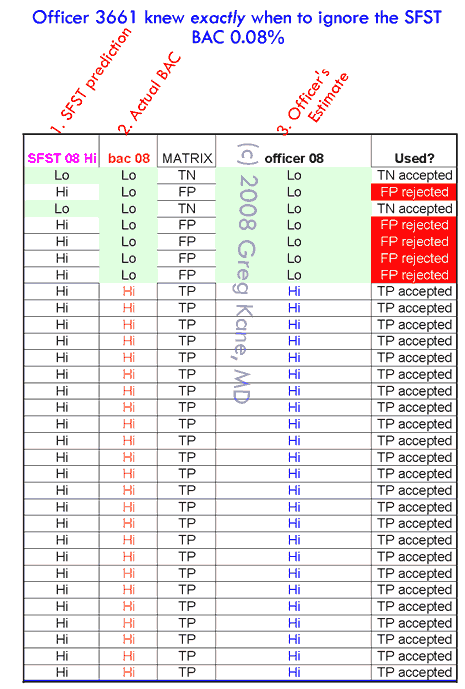 |
Same officer, now for BAC 0.08% NOTICE Every single time the SFST gave the wrong answer, officer 3661 rejected that answer. Officer 3661 never once rejected the SFST when the SFST gave the correct answer. The probability that this perfect distribution of rejections was random is vanishingly small. Officer 3661 must have used some method other than the SFST for determining BAC level in every case, for every driver. |
How SFST validation theory misleads juries
|